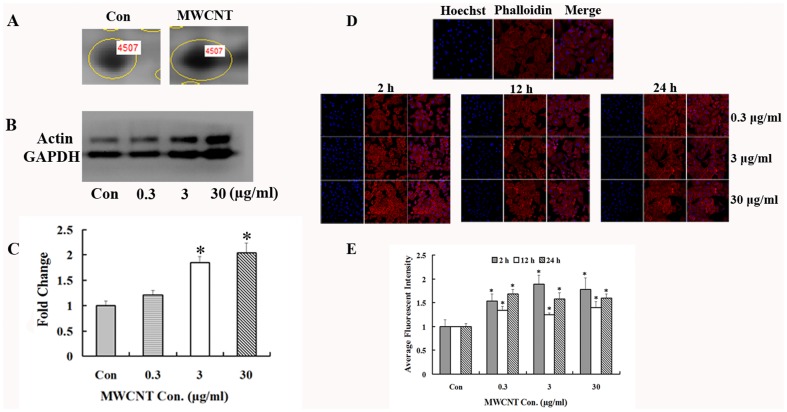
Figure 6. MWCNT treatment increases actin expression.
(A) Enlarged 2-DE images of spot 4507, which was up-regulated in MWCNT-treated A549 cells. (B) Western blot results for actin expression in A549 cells treated with 0.3, 3 and 30 µg/ml for 24 h. (C) Densitometry analysis of (B). GAPDH was used as a loading control, * p<0.05. (D) Immunofluorescence microscopic analysis of actin expression after MWCNT treatment. After treatment with MWCNT at 0.3, 3 and 30 µg/ml for 2, 12 and 24 h, cells were fixed and stained with phalloidin, then subjected to immunofluorescence microscopy. Shown are representative images from one of three independent experiments. Blue, Hoechst3358 stain for nuclei. Red, Actin. 10 µM Pt was used as a positive control. (E) Semi-quantification data of the average fluorescent intensity. * p<0.05, compared to control.

