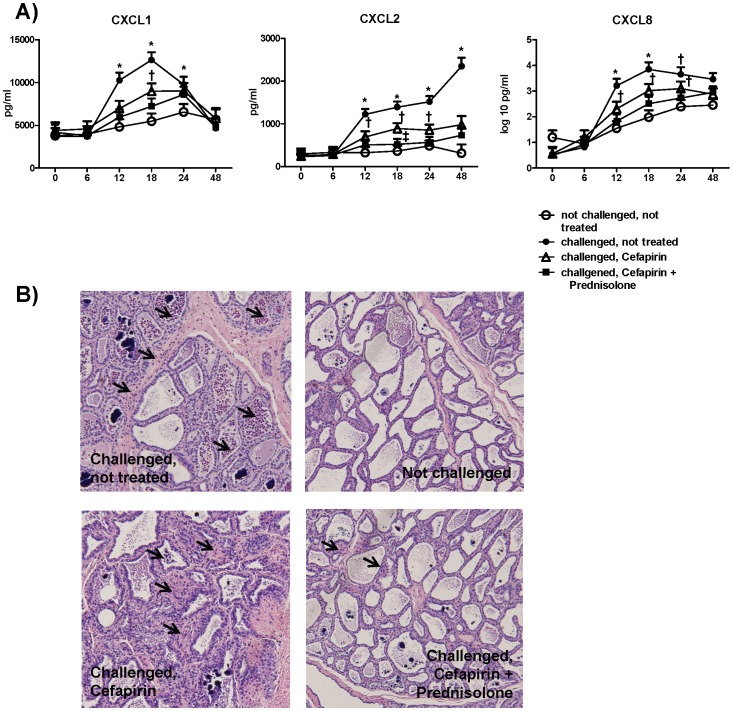
Figure 4. Levels of chemokines in milk whey.
A) Levels (pg/ml) of chemokines (CXCL1, CXCL2 and CXCL8) in milk whey were determined by ELISA at time of (0), 6, 12, 18, 24 (n = 6) and 48 h (n = 3) post challenge with 100 cfu E. coli. Per cow one quarter was left unchallenged (open circles) and one quarter was challenged but not treated (filled circles), one quarter was challenged and cefapirin treated (open triangles) and one quarter was challenged and treated with cefapirin plus prednisolone (filled squares) at 4, 12 and 24 h post challenge. Data are shown as LSM of chemokine levels plus standard errors. In the case of CXCL8 LSM of the log10 transformed levels are shown. Statistically significant differences (P<0.05) are indicated by * (significantly different to all other groups), † (significantly different to not infected, not treated) and ‡ (significantly different to infected, cefapirin treated). B) Example of H&E stained sections from four quarters of one animal at 24 h post challenge. Arrows indicate PMN in tissue.

