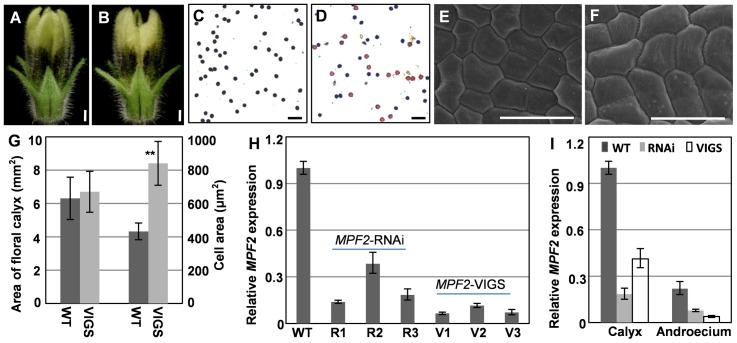
Figure 3. VIGS-mediated MPF2 silencing phenocopies MPF2-RNAi.
(A) An intact WT flower. (B) An intact MPF2-VIGS flower. Bars = 1 mm. (C) I2-KI stained pollen from WT. (D) I2-KI stained pollen from MPF2-VIGS. Active pollen is blue and sterile pollen is tawny. Bars = 100 µm. (E) Floral calyx epidermal cells of WT. (F) Floral calyx epidermal cells of MPF2-VIGS. Bars = 20 µm. (G) Size of calyx surface (gray column) and epidermal cells (white column) of the floral calyx in WT and MPF2-VIGS (“VIGS”). 20 cells and 20 calyces were analyzed for both WT and MPF2-VIGS samples. Mean values and standard deviation are presented. (H) Gene expression analysis of MPF2-RNAi and -VIGS. Expression of MPF2 was compared between MPF2-RNAi flowers (R1–R3), MPF2-VIGS flowers (V1–V3) and wild-type (WT) Physalis via qRT-PCR analysis. The severe MPF2 residual in VIGS was only 6% of that in the wild-type (WT), while in the RNAi the MPF2 residual was 14% of that in the wild-type (WT). PFACTIN was used as an internal control. (I) MPF2 expression was evaluated in two floral organs of VIGS flowers. Expression of MPF2 in MPF2-RNAi (gray column), MPF2-VIGS (white column) was compared with that in the wild-type (WT, black column). The gene expression in the calyx of the WT was set as 1, and PFACTIN was used as an internal control. The experiments were repeated with three independent biological samples. Mean expression values and standard deviation are presented.

