
Figure 1.
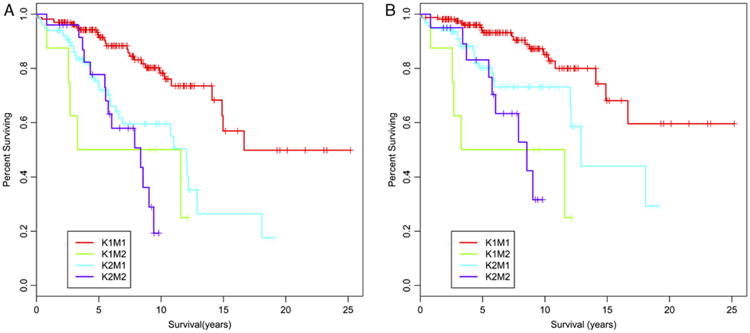
PanNETs that are G2 by either Ki67 index or mitotic rate show decreased overall survival and DSS compared with G1 tumors. Kaplan-Meier curves demonstrating the overall survival (A) and DSS (B) for each of the 4 groups of PanNETs in our study are shown: K1M1, Ki67 and mitotic G1; K1M2, Ki67 G1/mitotic G2; K2M1, Ki67 G2/mitotic G1; K2M2, Ki67 and mitotic G2. The P-values comparing the set of curves, calculated by a log rank test, are found in Table 1.