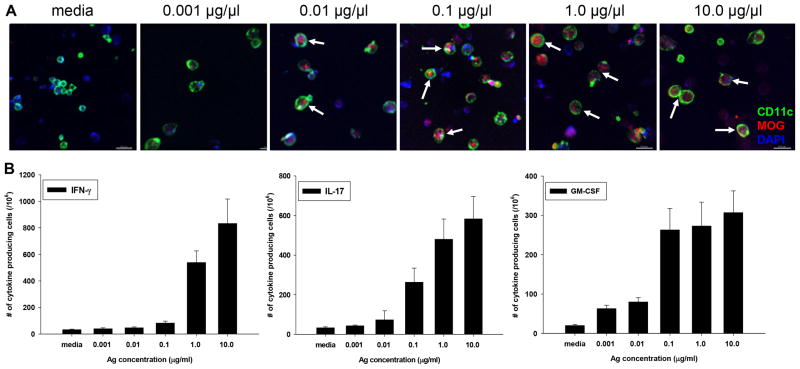
FIGURE 3.
MOG detection by confocal microscopy corresponds to activation threshold of pathogenic T cells. CD11c+ cells from Wt B6 mice and CD4+ cells from 2D2 TCR-tg mice were sorted by FACS and co-cultured in a 1:1 ratio with increasing concentrations of rMOG1-125 protein. (A) Detection of increasing levels of rMOG in CD11c+ DCs by confocal microscopy; shown is internal slice from z-stack depicting inside of cells; scale bars = 20 μm (B) Detection of MOG-specific T cell responses by cytokine ELISPOT assay upon incubation with DCs pulsed with increasing concentrations of rMOG protein. Shown is mean ± S.D. of number of cytokine spots over three separate experiments with three replicates each.

