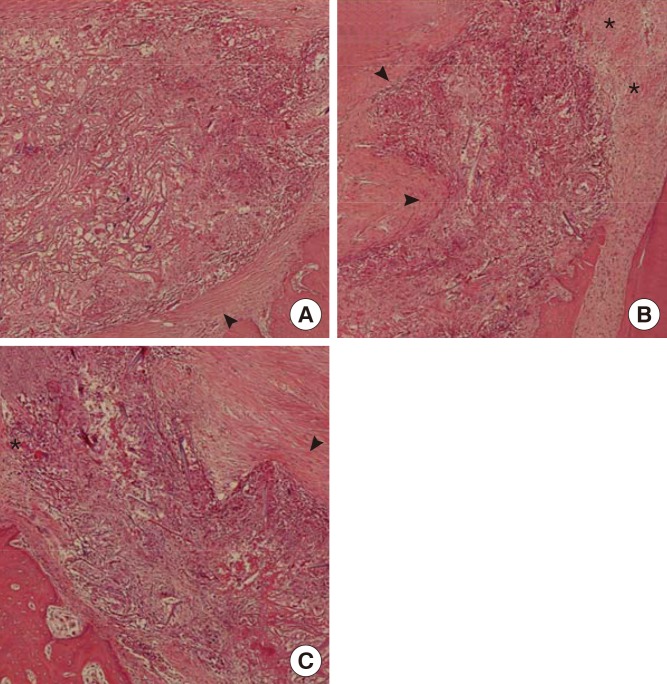
Figure 4.
Representative photomicrographs from sites implanted with different cell sources (H&E, ×100). High-magnification views of the experimental site in the 8-week normal saline group (A), the 8-week periodontal ligament cell group (B), and the 8-week dental pulp cell group (C). Arrowheads: fibrous capsules; asterisks: blood vessels.

