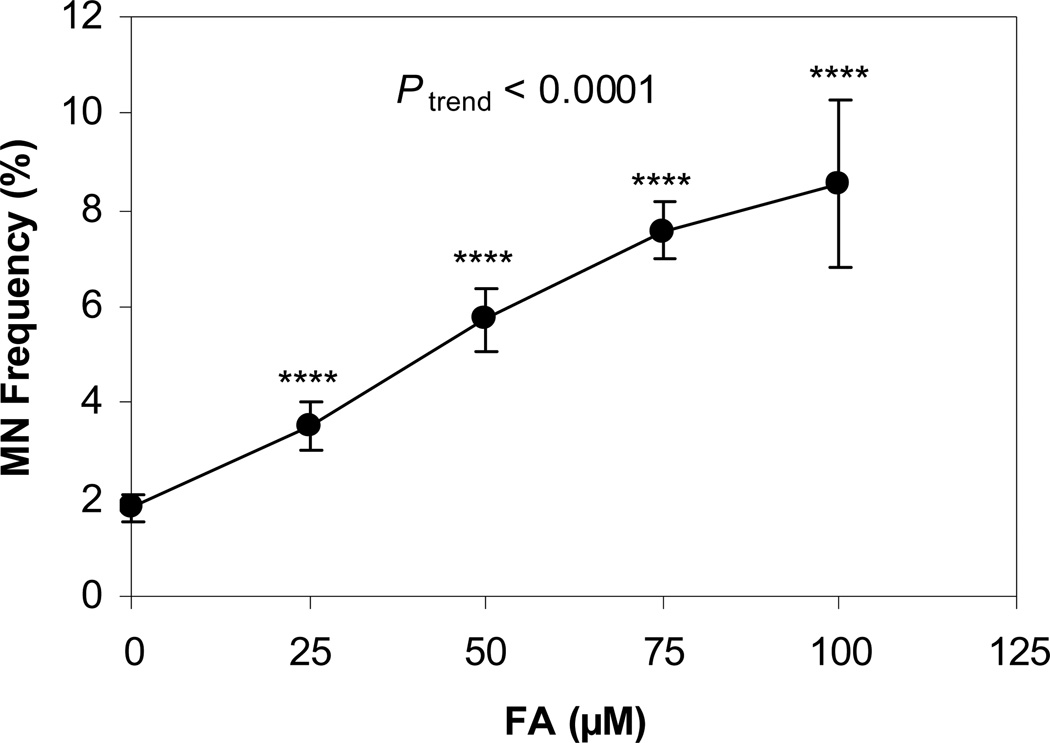
Figure 1. MN frequency in mouse erythropoietic cells after FA treatment.
Three independent experiments were conducted. Data is presented as mean ± standard error (SE). **** represents P < 0.0001, compared to the untreated control and Ptrend represents the p-value of the dose-response trend test. MN frequencies were significantly increased at each dose of FA and across all doses in a dose-dependent manner.

