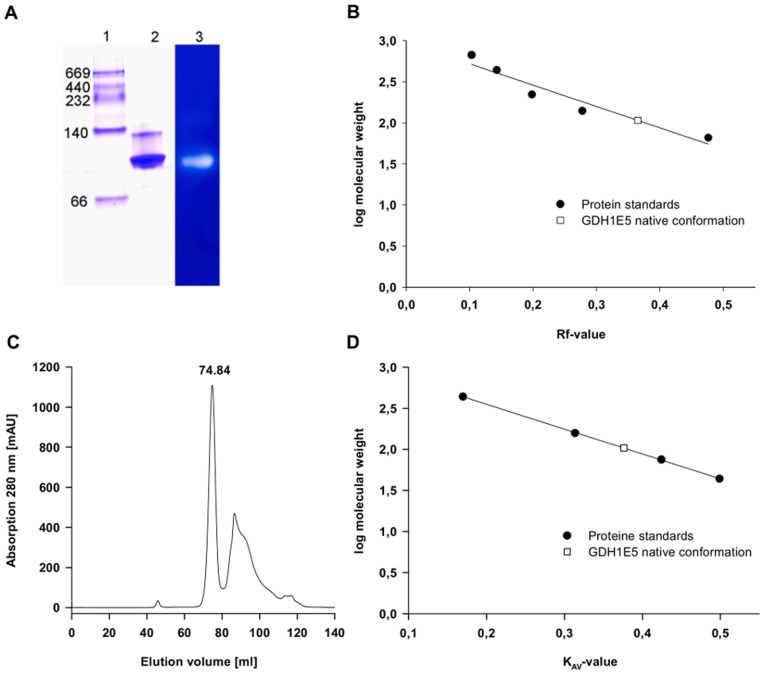
Figure 3. Molecular weight detection of native GDH1E5.
A: Native polyacrylamide gelelectrophoresis of the size exclusion chromatography step in combination with a glucose dehydrogenase activity staining. Lane 1: marker proteins: Thyroglobulin (669 kDa), Catalase (232 kDa), Lactate-Dehydrogenase (140 kDa) and Albumin (66 kDa). Lane 2: GDH1E5 after size exclusion chromatography step stained with Coomassie. Lane 3: Activity staining of the native PAGE using glucose as substrate and DCPIP as colorimetric indicator and electron acceptor. Glucose-Dehydrogenase activity is indicated by a clear halo in regards to the decolorization of reduced DCPIP. B: Plot of the retention value Rf of the marker proteins and GDH1E5 versus the logarithm of their regarding molecular weight. C: Chromatogram of the purification step of GDH1E5 via size exclusion chromatography using HiLoad 16/60 Superdex 200 prep grade. D: Plot of partition coefficient KAV from the derived elution volumes of the marker proteins (Ferritin 440 kDa, Aldolase 158 kDa, Conalbumin 75 kDa, Ovalbumin 44 kDa) and GDH1E5 versus the logarithm of their regarding molecular weight.

