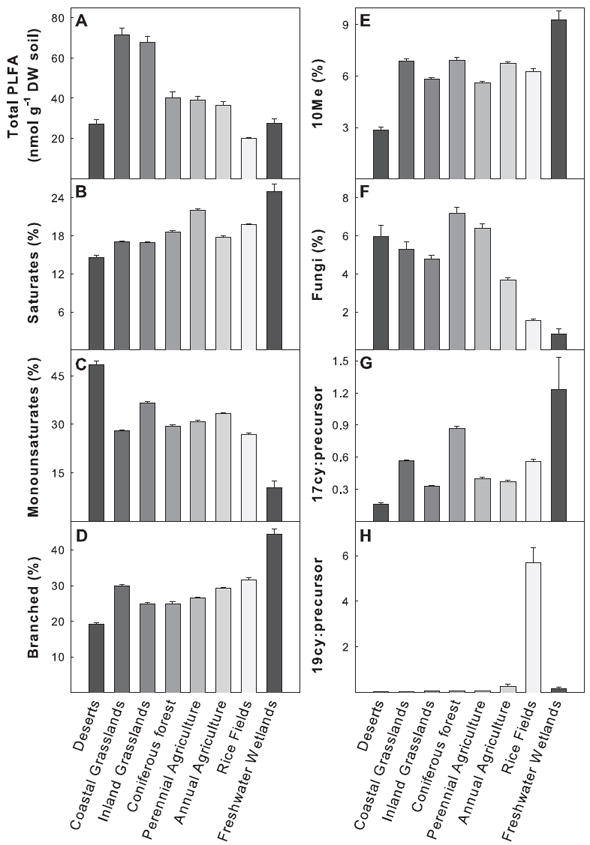
Figure 5.

(a)–(h) Biomass (Total PLFA) and biomarker values for all land-use types. Biomarkers represent selected groups of microorganisms: Saturates, common in many bacteria; Monosaturates, Gram (−) bacteria; Branched, Gram (+) bacteria; 10Me, actinomycetes or sulfate-reducing bacteria (see Results). The ratios 17cy:precursor and 19cy:precursor indicate physiological stress. Note that the scaling of the axes is not the same in all panels. Data are means ± SE (n = 32–358).
