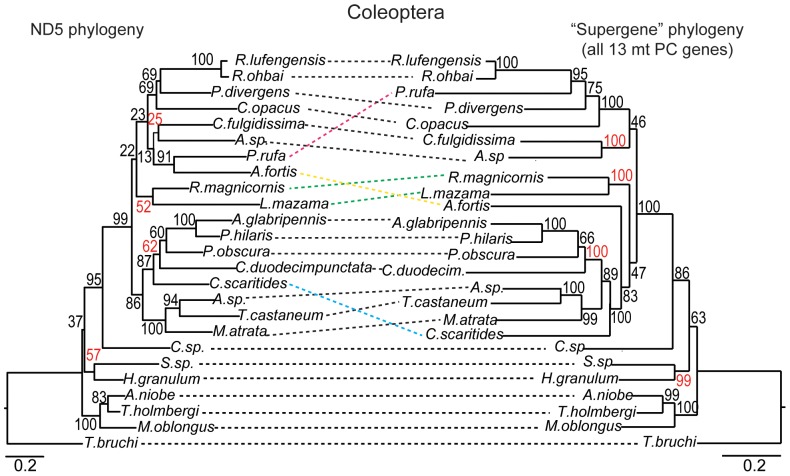
Figure 2. Example demonstrating discordance between the ND5 and the “supergene” phylogenies based on a specific lineage/dataset.
Here, the two phylogenies for the Coleoptera were significantly different based on the Shimodaira-Hasegawa (SH) test and the ΔLn L between them is 264.6. For this example, a minimum of four mt protein-coding (PC) genes were required to infer a statistically indistinuishable topology to that of the “supergene” set (i.e., all 13 mt PC genes) when genes were selected by length, although the three mt PC genes that performed “best” (ND5, ND4, ND2) also inferred it. Clades/OTUs in the phylogeny showing different positions and/or relationships between the topologies are connected by colored lines, while those with the same positions and/or relationships are connected by black lines. Bootstrap support values (numbers at nodes) that increased noticeably for clades in the “supergene” topology as compared to ND5 are presented in red. Phylogenies analyzed here utilized amino acid data and were inferred via maximum likelihood (scale bars indicate replacements per site).

