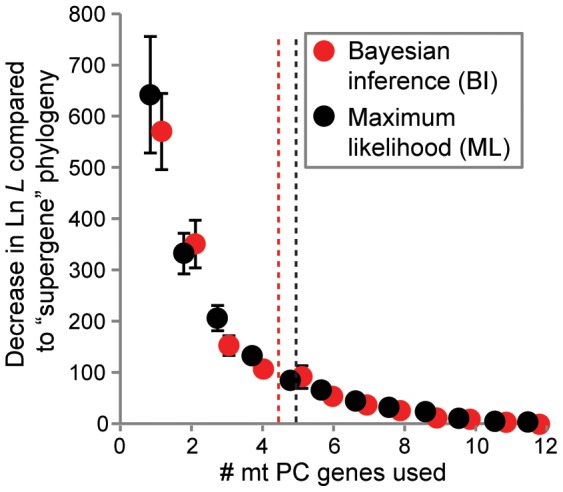
Figure 8. Comparisons between maximum likelihood (ML) and Bayesian inference (BI) on concatenated mt protein-coding (PC) gene sets relative to that of the “supergene” set.

Average decreases (± S.E.M.) in Ln L between phylogenies based on concatenated alignments of the longest mt protein-coding (PC) genes (from one to 12 genes) relative to the “supergene” (i.e., all 13 mt PC genes) phylogeny. The average gene number when this difference becomes significantly worse based on Shimodaira-Hasegawa (SH) tests is indicated by a vertical dashed line (as in Figure 4A). Phylogenies utilized amino acid data and were inferred via either ML or BI for the 32 lineages with > 40 OTUs examined in this study. Overall, there was no difference in the minimum number of genes needed to recreate the “supergene” topology when using BI or ML methods (vertical dashed lines; Poisson regression, z = 0.74, df = 1,31, P = 0.458).
