
Figure 4.
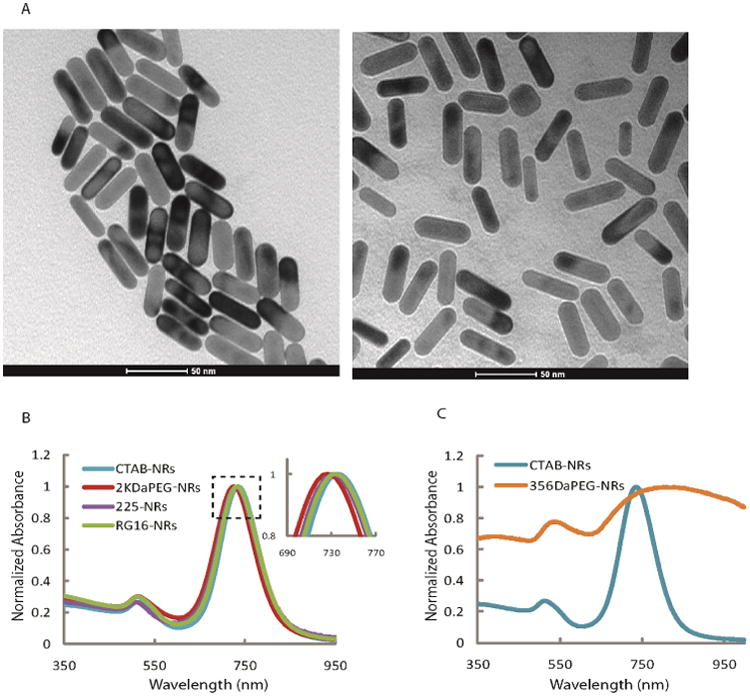
a) Transmittance electron microscopy images of as prepared CTAB coated gold nanorods (left) and the nanorods after modification with mPEG-thiol molecules (right). b) Extinction spectra of as prepared gold nanorods (blue) and the nanorods after modification with either 2 kDa mPEG-thiol (red); clone c225 (purple) and RG16 (green) antibodies. c) Comparison of extinction spectra of as prepared gold nanorods (blue) and nanorods after ligand exchange using small molecular weight, 300 Da MW, mPEG-thiol molecules (orange). Aggregation of nanorods is evident from profound spectral changes (orange spectrum).