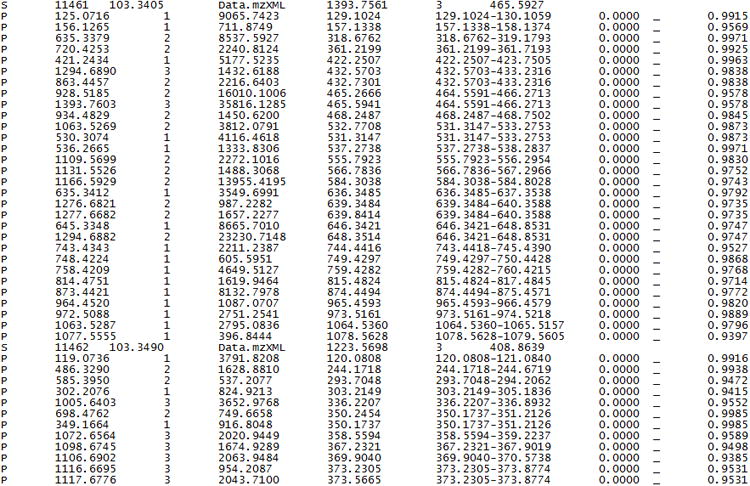
Figure 2.

Sample of Hardklör output. The output is in tab-delimited ASCII text. Each line is labeled as either spectrum (S) information or peptide feature (P) information. Details of the output file contents can be found on the Hardklör website at: http://proteome.gs.washington.edu/software/hardklor/tutorial.html#results
