
Figure 3.
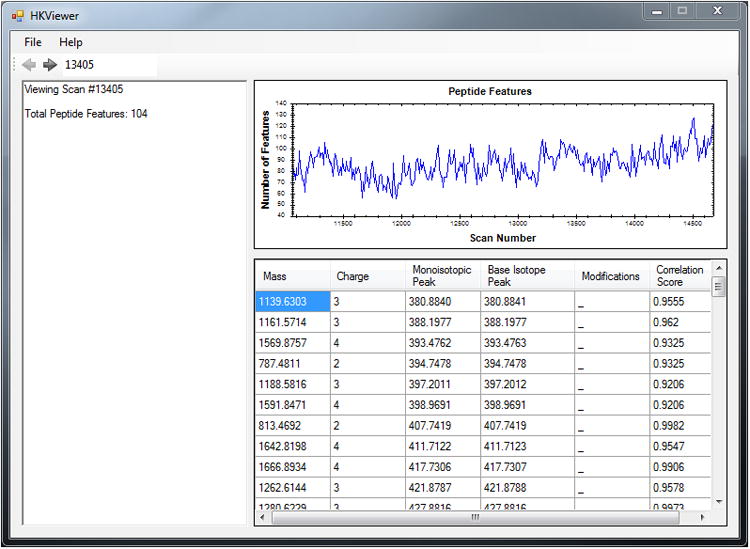
The HKViewer. This Windows-based graphical user interface presents Hardklör results to the user on a scan-by-scan basis using the navigation toolbar at the top left of the window. The graph in the upper right displays the distribution of peptide features identified with Hardklör across the input scan data.