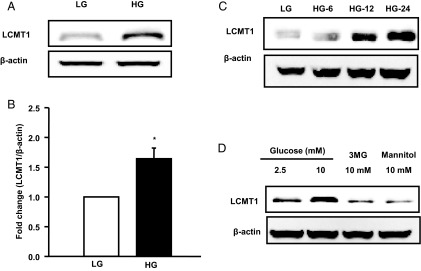
Figure 6.

HG conditions increase LCMT1 expression in INS-1 832/13 cells. INS-1 832/13 cells were cultured in the presence of LG (2.5mM) and HG (20mM) for 48 hours, after which expression of LCMT1 was determined in cell lysates by Western blotting. Actin was used as a loading control. Representative blot indicating increased expression of LCMT1 under HG conditions is shown in A. Densitometric quantitation of LCMT1 is provided in B. These data are expressed as mean ± SEM. *, P < .05 vs LG (n = 3 determinations). In another set of experiments (C), INS-1 832/13 cells were treated with either LG or HG for 6 hours (HG-6), 12 hours (HG-12), and 24 hours (HG-24) as indicated in the figure. Lysate proteins were separated by SDS-PAGE and a representative blot from 2 independent studies. These findings indicate a time-dependent effect of glucose on LCMT1. D, INS-1 832/13 cells were incubated with basal glucose (2.5mM), HG (10mM), 3MG (10mM), or mannitol (10mM) for 24 hours. Relative abundance of LCMT1 is quantitated by Western blotting. A representative blot from 3 independent experiments is shown here.
