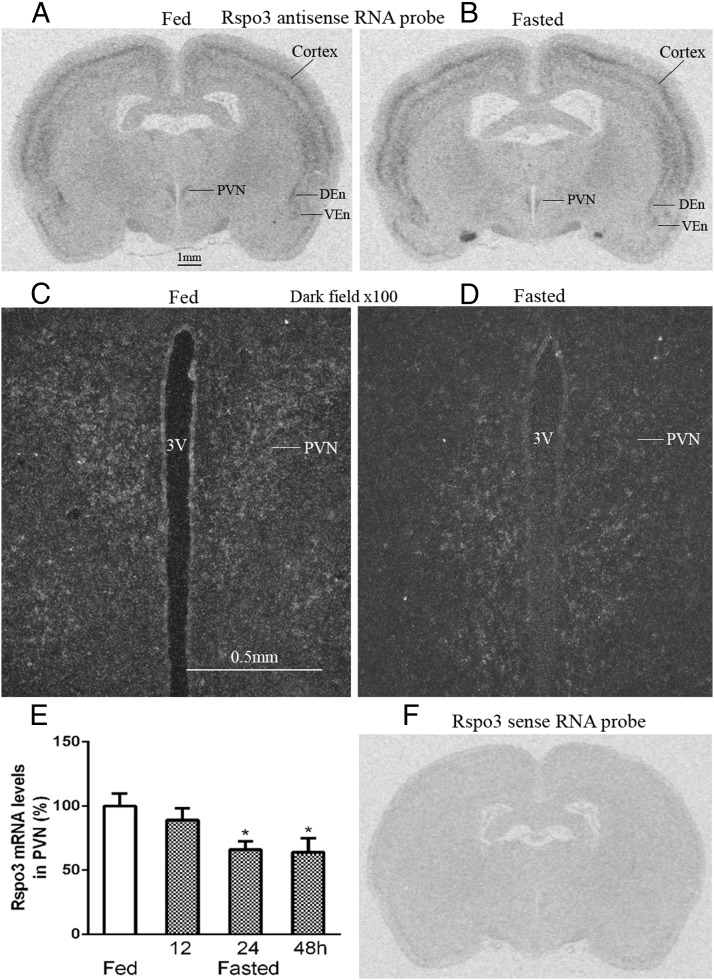
Figure 5.
Distribution of Rspo3 mRNAs in the rat brain. A, Fed rat brain. B, Fasted rat brain. C and D, Dark field photomicrograph of PVN areas of fed and fasted rat. 3V, third brain ventricle; DEn and VEn, dorsal and ventral endoform nuclei. E, Densitometry analysis of Rspo3 mRNA level in PVN. n = 5; *, P < .05. F, Rspo3 sense RNA probe.

