Figure 3.

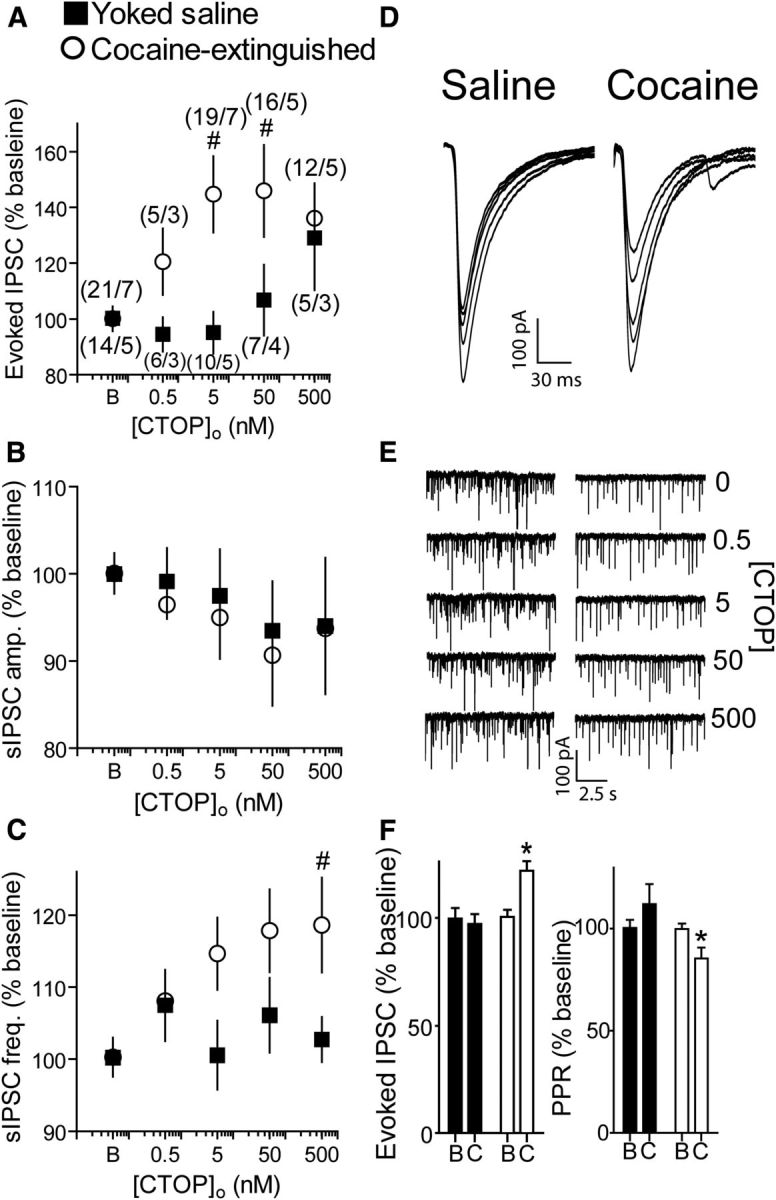
CTOP, a μ-opioid receptor antagonist, potentiated GABA release in cocaine-extinguished but not yoked saline rats. A, CTOP dose-dependently potentiated GABA eIPSCs after extinction of cocaine self-administration but not in yoked saline rats (two-way ANOVA; F(1,104) = 7.44, p < 0.05 for main effect of group). Number of replicates is presented as number of cells/number of rats for each data point. Number of cells and rats is the same for B, C. B, CTOP did not alter sIPSC amplitude in either group. C, CTOP increased sIPSC frequency in cocaine-extinguished rats but not in yoked saline rats (two-way ANOVA; F(1,106) = 5.79, p < 0.05 for main effect of group). D, Representative traces of eIPSCs with increasing doses of CTOP (0, 0.5, 5, 50, 500 nm) in yoked-saline and cocaine-extinguished rats. E, Representative traces of sIPSCs in yoked-saline (left) and cocaine-extinguished (right) rats with increasing CTOP concentrations. Note the increase in sIPSC frequency in cocaine-extinguished rats. F, CTAP, a second μ-opioid receptor antagonist, potentiated eIPSCs in cocaine-extinguished rats but not in yoked saline rats (left, two-way ANOVA; F(1,29) = 8.27, p < 0.05 for main effect of group; F(1,29) = 7.31 for interaction effect group × treatment). This was accompanied by a change in PPR in cocaine-extinguished rats but not in yoked saline rats (two-way ANOVA; F(1,27) = 5.65, p < 0.05 for main effect of group; F(1,27) = 5.34, p < 0.05 for interaction effect group × treatment). Data collected from three yoked saline rats (six cells) and four cocaine-extinguished rats (11 cells). B, Baseline; C, 50 nm CTOP. *p < 0.05 compared with CTAP in yoked saline using two-way ANOVA and Bonferroni post hoc analysis. #p < 0.05 compared with baseline using one-way ANOVA and Bonferroni post hoc analysis. Data presented as mean ± SEM.
