Figure 7.

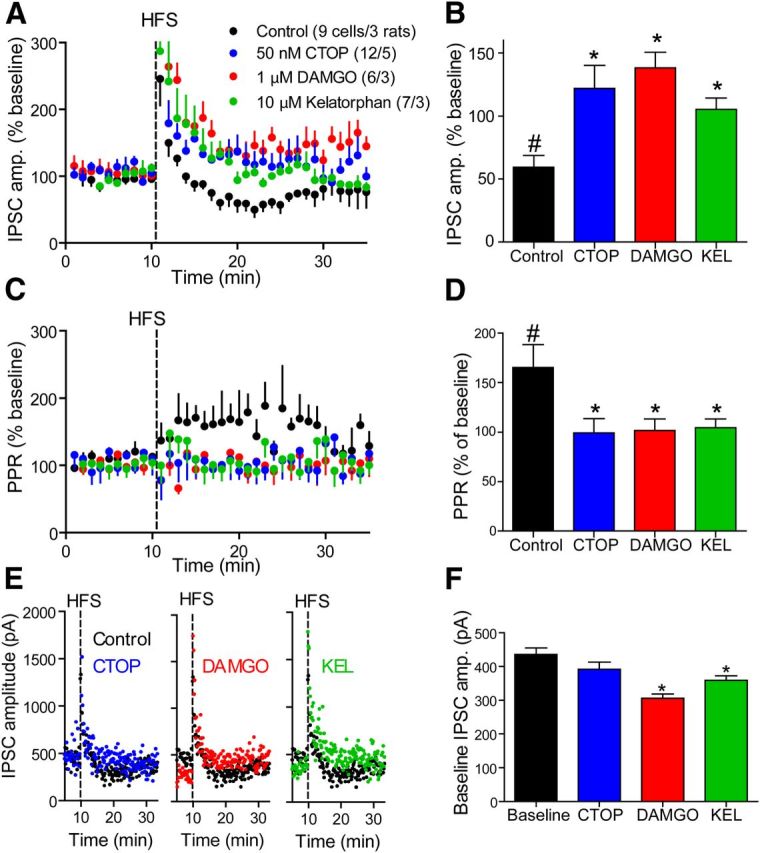
Loss of LTDGABA under tonic activation or inhibition of μ-opioid receptors. A, Time course of GABA eIPSCs after HFS (vertical dashed line) in control (black) and in the presence of either 50 nm CTOP (blue), 1 μm DAMGO (red), or 10 μm kelatorphan (green). Compounds were present throughout the experiment and were never washed out. The HFS generated a LTDGABA that was abolished in the presence of either compound. Number of cells in legend is the same for B–D, F. B, Average eIPSC amplitude taken from 18 to 24 min in A. In control conditions the eIPSC is inhibited to 62.1 ± 12.5% of baseline and is significantly different from in the presence of CTOP (121.9 ± 18.1% of baseline), DAMGO (138.3 ± 12.3% of baseline) and kelatorphan (105.4 ± 8.9% of baseline). C, Time course of the PPR in the same experiment shown in A. The PPR was elevated only in the control conditions and the elevation was synchronous with the LTDGABA shown in A. D, Average PPR during 18–24 min from experiment depicted in A. PPR was elevated in control conditions to 165.4 ± 23.2%. In all other conditions, PPR remained unchanged. E, Representative raw experiments with each compound compared with control condition. Note the difference in baseline between control condition and in the presence of DAMGO or kelatorphan. F, Average raw baseline eIPSC amplitudes in each condition. In the presence of DAMGO or kelatorphan the eIPSC was under tonic depression. KEL, Kelatorphan. #p < 0.05 compared with 100% using a one-sample t test. *p < 0.05 compared with control condition (C, D) or baseline (H) using one-way ANOVA and Dunnett's multiple-comparison post hoc analysis. Data presented as mean ± SEM.
