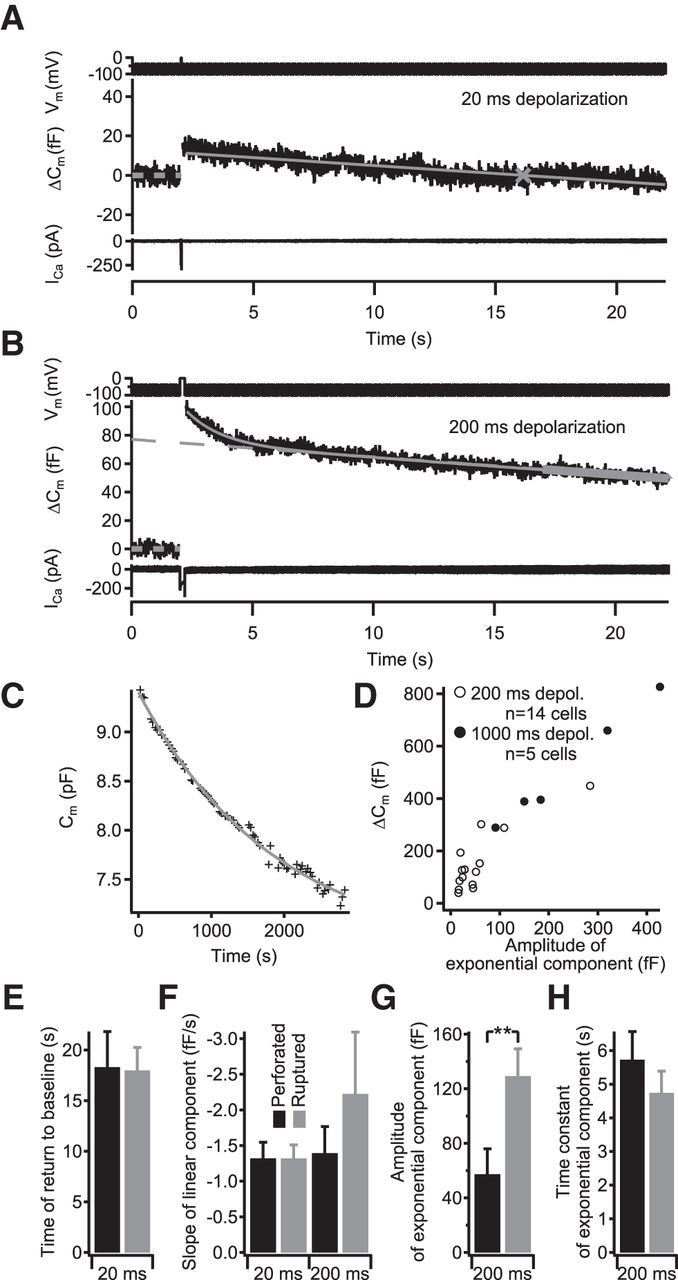
Figure 5.

Endocytic Cm decline in control IHCs. A, B, Representative recordings in response to 20 (A) or 200 (B) ms depolarizations. The command voltage consisted of a 2-s-long predepolarization sine wave part, the depolarizing pulse, and a 20-s-long postdepolarization sine wave part (top). After the depolarization-induced Cm increase, the slope-corrected Cm traces (middle) typically showed a linear decay after 20-ms-long depolarizations (A), which was analyzed by subtracting the baseline Cm (dashed bold gray line) from 0–2 s and fitting a linear function to the Cm data (gray line), thus obtaining the time of return to baseline Cm (gray mark). The 200-ms-long depolarizations typically resulted in a combination of exponential and linear decay (B). This was analyzed by fitting a linear function to the final 5 s of Cm data (bold gray line), which was extrapolated (dashed gray line) and subtracted from the Cm data. The residual was fitted with an exponential function (gray line shows combined linear and exponential). C, Representative example of Cm slope correction in an IHC. The correction for baseline Cm drift was performed by monitoring the baseline Cm during the experiment (black symbols) and fitting an exponential function (gray line), which was then subtracted from the individual recordings. D, Recordings after longer depolarizations showed an exponential component whose amplitude increased with the total amount of previously exocytosed membrane. Open circles are cell averages from 200 ms depolarizations, and filled circles are cell averages from 1000 ms depolarizations. E–H, Comparison of time of return to baseline (E), slope of the linear component of membrane retrieval after short (left) and prolonged (right) exocytosis (F), and the amplitudes (G) and time constants (H) of the exponential component of membrane retrieval in from IHCs recorded in perforated-patch (black) or ruptured-patch configuration (gray). The perforated-patch data (n = 17 and n = 14 cells for short and prolonged depolarization, respectively) are taken from the Dyn+/+ cells shown in Figure 9, and the ruptured-patch data (n = 18 and n = 16 cells for short and prolonged depolarization, respectively) are pooled from the control cells shown in Figures 7 and 10.
