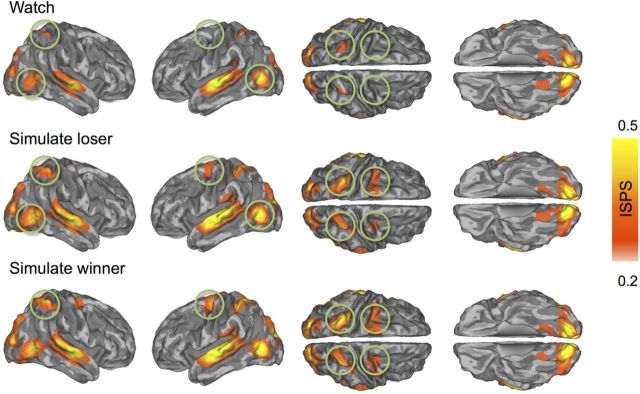
Figure 4.
Brain regions showing statistically significant ISPS during passive viewing (top), simulation of a losing (middle), and simulation of a winning (bottom) boxer. The maps are thresholded at p < 0.05 (FDR corrected). Circles point to regions where ISPS was larger during explicit simulation versus passive observation conditions. Color bar denotes the ISPS statistic range.

