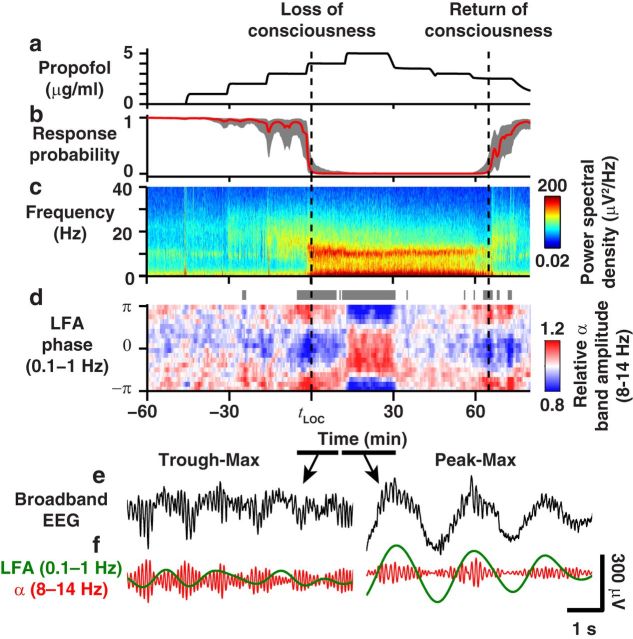
Figure 1.
Phase-amplitude coupling reveals a transition during general anesthesia. a, Propofol effect-site concentration. b, Probability of response to sounds (red line indicates median; gray represents 5–95% confidence interval). c, Power spectrum of frontal EEG shows increased LFA and α band power during unconsciousness. d, Modulation of α power by LFA phase (gray bars represent p < 0.005, permutation test). e, f, Raw (e) and bandpass-filtered (f) EEG traces during trough-max (left) and peak-max (right) coupling.

