
Figure 4.
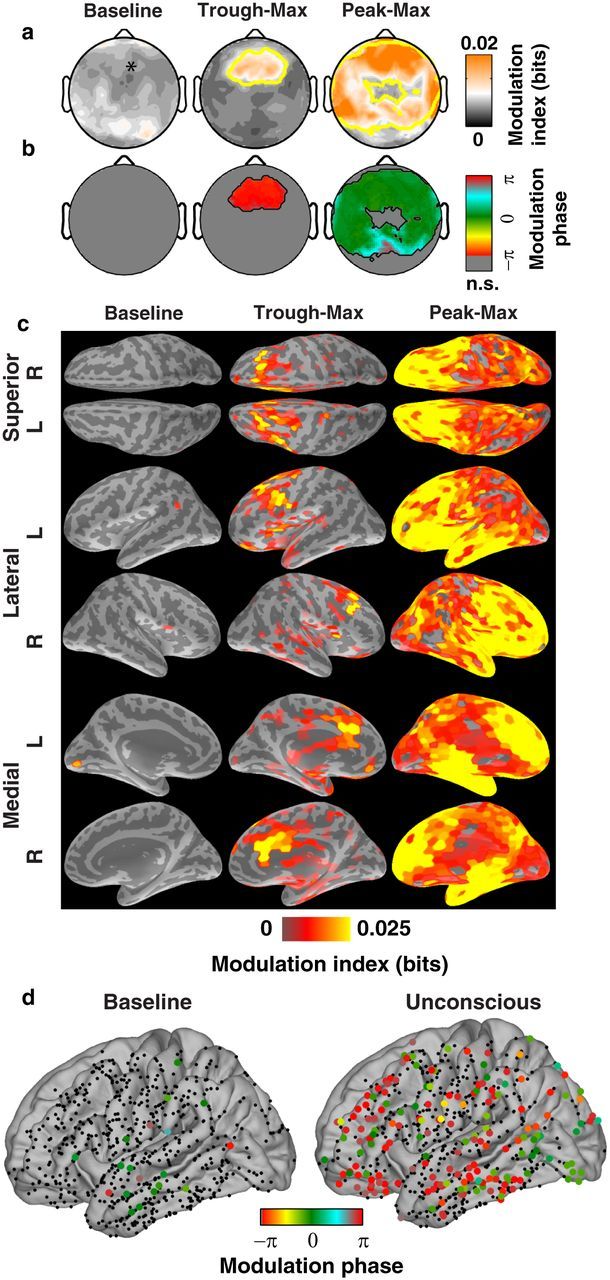
Spatial distribution of phase-amplitude coupling. a, b, Scalp distribution of MI (a) and phase (b) (median across 10 subjects). *Location of frontal electrodes used in Figs. 1, 2, and 3. a, Yellow contour indicates locations where at least 6 of 10 subjects had significant modulation (p < 0.05; n.s., not significant). c, Average MI at cortical patches estimated by source localization analysis of the EEG. Only patches with significant modulation are included (1% false discovery rate). d, Locations of intracranial cortical surface electrodes (n = 605 sites, 8 patients), mapped to an average cortical surface. Colored points indicate modulation phase of electrodes with significant phase-amplitude coupling.