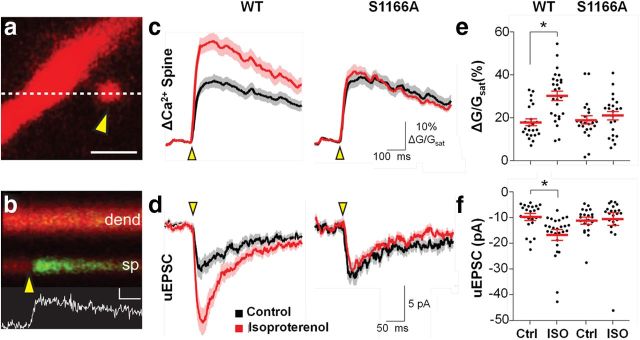
Figure 3.
Ser1166 of GluN2B is essential to β-adrenergic-induced Ca2+ rises in spines. a, Representative 2PLSM image of a dendritic spine from a CA1 hippocampal neuron filled with the red fluorophore AlexaFluor-594 and the green Ca2+-sensitive indicator Fluo-5F. The yellow arrowhead indicates the location of a 500 μs pulse of 720 nm laser light used to focally uncage glutamate near the spine head. White dashed line indicates the region used for line scan analysis of fluorescence. Scale bar, 1 μm. b, Red and green fluorescence in the spine head (sp) and neighboring dendrite (dend) measured in a line scan over the region indicated by the dashed line in a. Inset scale bars, 100 ms and 5% ΔG/Gsat. Yellow arrowhead indicates time of uncaging. The increase in green fluorescence indicates increased intracellular Ca2+, and the corresponding spine Ca2+ transient (white trace) is below. c, Average trace of uncaging-evoked ΔCa2+spine produced by single uncaging stimuli in neurons expressing GluN2B(WT) (left) or GluN2B(S1166A) (right) under control conditions (black) or after isoproterenol incubation (red). Mean (solid lines) and mean ± SEM (shaded regions) are shown. d, Average trace of uEPSCs produced by single uncaging stimuli in neurons expressing GluN2B(WT) (left) or GluN2B(S1166A) (right) under control conditions (black) or after isoproterenol incubation (red). e, Population data for peak ΔCa2+spine and (f) uEPSC elicited by single uncaging stimuli in neurons expressing GluN2B(WT) or GluN2B(S1166A) under control conditions (Ctrl) or after isoproterenol incubation. Red bars represent the mean of distribution ± SEM. *p < 0.001.

