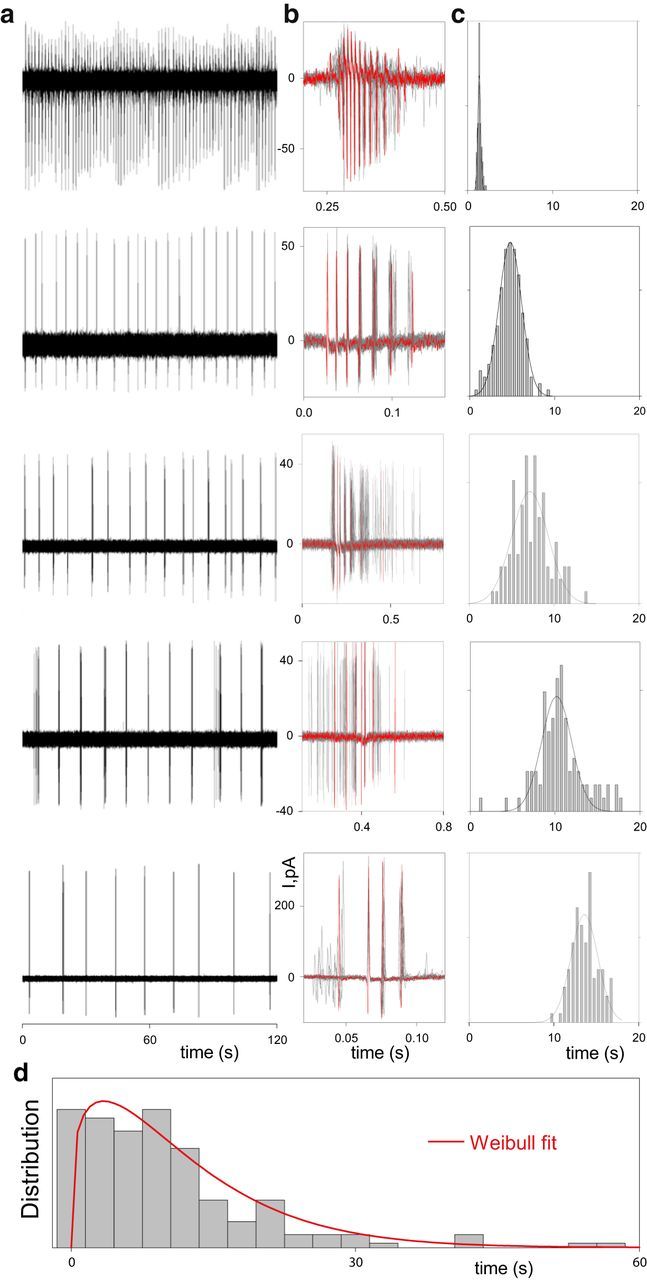
Figure 1.

Characteristic of spontaneous activity of bORNs recorded extracellularly. Examples of bORNs (a) with different intrinsic bursting parameters: burst structures (b) and bursting frequencies (c). Each raw represents a different cell. Bursting parameters for the cells shown (from top to bottom; mean IBI ± SD; sec, number of spikes in burst; burst duration, sec; n): 1.34 ± 0.18, 10.5 ± 0.14, 0.16 ± 0.003, 119; 4.78 ± 1.34, 5.73 ± 0.06, 0.08 ± 0.001, 165; 7.17 ± 2.14, 5.8 ± 0.06, 0.166 ± 0.004, 99; 10.2 ± 1.77, 5.98 ± 0.08, 0.23 ± 0.006, 108; 13.6 ± 1.59, 4.02 ± 0.04, 0.06 ± 0.001, 98. Current scales are the same in a, b. b, Superposition of at least 20 bursts shown for each ORN. Bursts are aligned relative to the highest instantaneous frequency within each burst. Red traces show single individual bursts. c, IBI histogram and a normal fit. Bin width is 0.5 s except top ORN (0.1 s). Note that the frequency of spontaneous bursting and the burst structure for any given cell were consistent. d, Distribution of spontaneous burst frequencies across bORN subpopulation evaluated extracellularly (N = 187, bin width 3 s). Solid line shows the Weibull fit.
