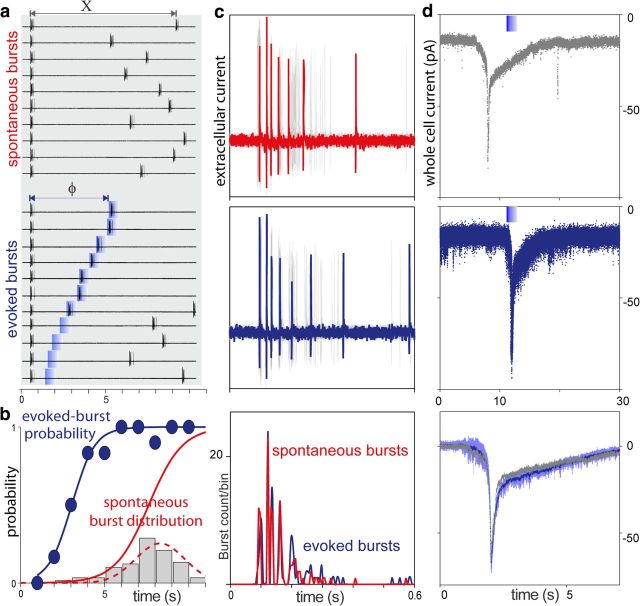
Figure 2.
Analysis of odor-evoked activity of a bORN. a, Extracellular single unit recording of spontaneous bursts (top) and stimulus-evoked activity (bottom) of the same ORN. Blue bars mark odor application. Stimuli were always applied randomly, independent of any ongoing activity. Segments of the trials aligned relative to preceding spontaneous bursts. a, Bottom, Recordings were also aligned according to the time interval between last spontaneous burst and the stimulus application. The time interval increases from the bottom to the top of the panel. b, Plot of the probability of eliciting a burst in response to an odorant (blue symbols and sigmoid fit) as a function of the time since the last burst and odorant pulse (probability estimated over 1 s bins). Superimposed IBI histogram represents probability density function and cumulative distribution function for the spontaneous bursts (gray bars and red curves, bin width 1 s). c, Comparison of the structure of spontaneous (top) and evoked (middle) bursts for the same ORN as in a, b. Bursts are aligned relative to the pair of spikes within each burst yielding greatest instantaneous frequency. Superposition of 20 bursts is shown in each case. Black (c, top panel) and blue (c, middle panel) traces show individual spontaneous and evoked bursts respectively. Aligned spike histograms (c, bottom) were generated using 5 ms bin width for 24 spontaneous and 23 odor-evoked bursts. Note that the structures of spontaneous (red) and odor-evoked (blue) bursts are similar. d, Comparison of the spontaneous (top) and odor-evoked (middle) whole-cell currents (holding potential was −70 mV) recorded from another bORN. Superposition of seven current traces (responses, d, middle) is shown. Blue bars mark odor application. Average response (n = 7, light blue: SD area) and spontaneous current trace were aligned relative current peak time and baseline current level (d, bottom). Note that the patterns of spontaneous (gray) and odor-evoked currents are similar.

