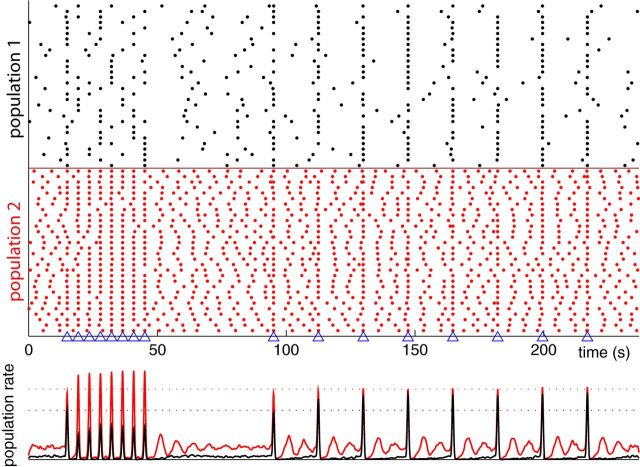
Figure 4.
Frequency selective synchrony of bORN responses. Two sets of homogeneous uncoupled populations with parameters same as Figure 3 are stimulated with epochs of periodic odor encounter matching their maximum tuning (17.4 and 4.3 s, respectively, for population 1 and 2, marked with triangles). Raster plot (top) and average firing rate (bottom) of each subpopulation for stimulation illustrates the synchronization selectivity. Dotted line shows the response level in the asymptotic state. Note that population 1 has reduced synchronization for shorter stimulus intervals, whereas population 2 amplifies the degree of synchrony. For longer stimulus intervals, population 1 enhances, whereas population 2 maintains the same level of synchrony. Subsample of 30 neurons are plotted for the raster, and 1000 neurons were used for estimating the population rate.

