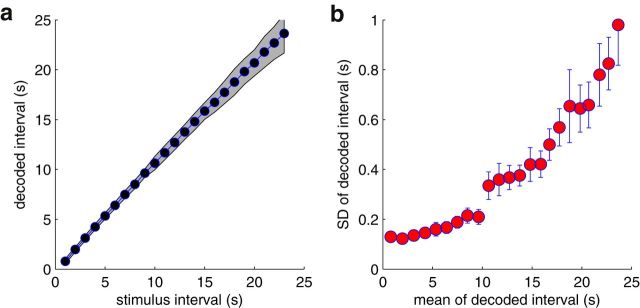
Figure 7.
Decoding performance as a function of different stimulus time intervals. Each stimulus interval was simulated 100 times to derive the statistics. a, Distribution of ML decoded intervals. Gray area represents the 95% confidence interval. b, Relation between ML estimate and its empirical SD obtained via bootstrapping.

