
Figure 11.
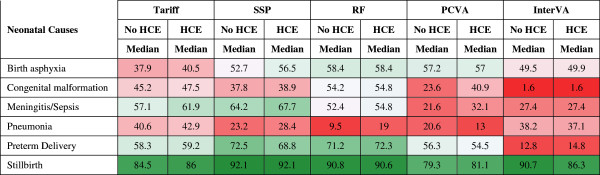
Sensitivity (%) for five methods for six neonatal causes. Figure 11 shows the median sensitivity for each method (except King-Lu which does not provide individual cause of death assignments) for five neonatal causes and stillbirth. Cells are shaded from red (low sensitivity) to green (high sensitivity) to help identify the relative differences between sensitivities across methods and causes. HCE, health care experience; PCVA, physician-certified VA; RF, Random Forest; SSP, Simplified Symptom Pattern; VA, verbal autopsy.