
Figure 9.
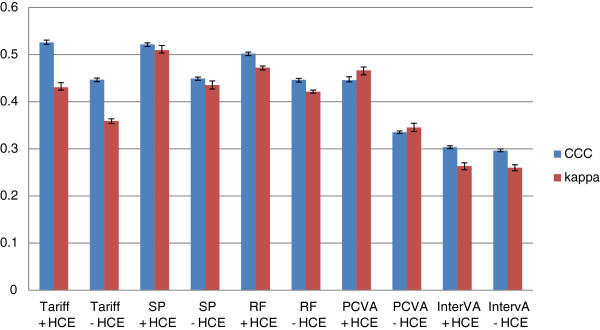
Histogram of child Cohen’s kappa and CCC for 5 analytical methods across 500 splits. Comparative performance of five methods according to Cohen’s kappa (%) and chance-corrected concordance (%) for child causes with and without health care experience (HCE). CCC, chance-corrected concordance.