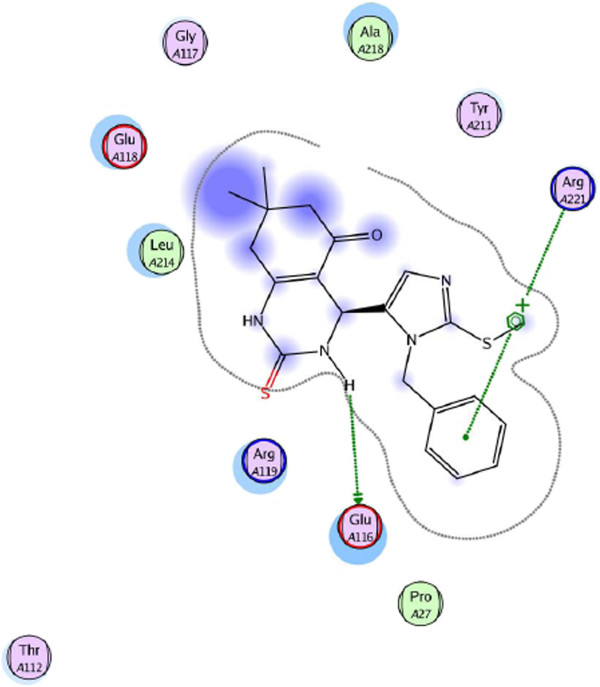
Figure 5.

2D graph of interactions between synthesized compound 4b and protein made by LigX module of MOE software. In the 2D graphs hydrophobic/aromatic residues are colored in green, whereas polar amino acids are shown in magenta. H-bonds and all π-stacking interactions are represented as green dotted lines. The active site contour is also shown.
