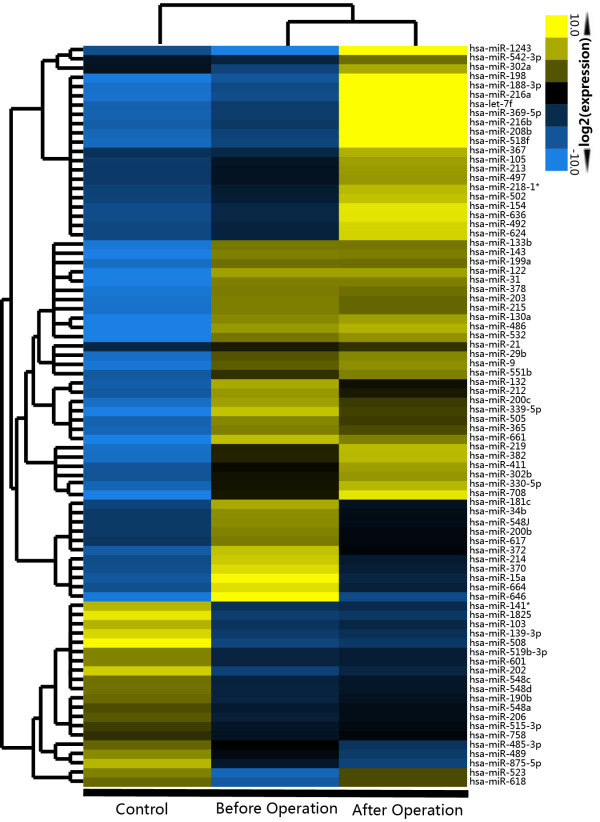
Figure 2.
The heat map displays the top 80 microRNAs with the most differential expression levels in the control and the patients before and after surgery. The average level for each of the 3 miRNA serum samples was set as 1. The fold changes of individual miRNAs of the control and before or after surgery against the average miRNA level were analyzed by unsupervised hierarchical clustering.

