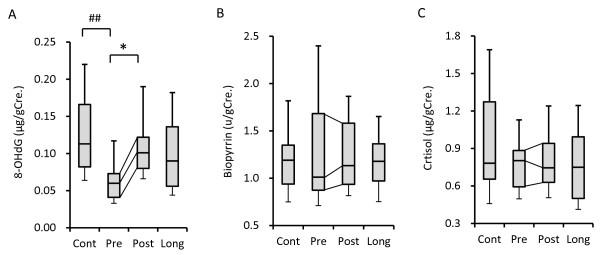
Figure 3.

Change of stress-related urinary biomarkers by 12 weeks of yoga training. Box plot representing the stress-related urinary biomarkers of the yoga-training group (n = 23) before (Pre) and after (Post) yoga training with reference control (Cont) and long-term yoga groups (Long). The 25th and 75th percentiles are represented by the lower and upper borders of the grey box. The dark line within the grey box represents the median. The whisker error bars represent the 10th and 90th percentiles. (A) The urinary 8-Hydroxydeoxyguanosine (8-OHdG) concentration after 12-weeks of yoga training showed a significant increase compared with that before starting yoga training. The urinary 8-OHdG concentration of the yoga-training group before yoga training was significantly lower than that of the control group from our previous study. (B, C) No significant changes were observed in the levels of urinary biopyrrin and cortisol after the 12 weeks of yoga training. Statistically significant differences are shown: *P < 0.05 (Wilcoxon signed-rank test), ##P < 0.01 (Mann-Whitney U-test).
