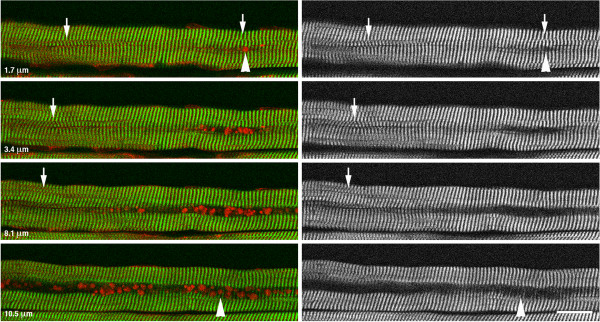
Figure 4.

Second Harmonic Generation (SHG) microscopy of a single fiber from an LOPD muscle biopsy. Stacks of SHG and autofluorescence images were recorded with a step of 0.85 μm to image the whole fiber from top to bottom. SHG (green) shows myosin bands, whereas autofluorescence (red) shows the inclusions. Several images from one series are shown here. The distance from the top of the fiber is indicated. As the focal plane encounters the first inclusions, the interruption of the myosin bands is clear. The interruption becomes the “black hole” of autophagic areas (see text). As the focal plane reaches the other side of the particles, thin partial myosin bands are seen. Arrowheads point to the interruptions, total or partial of the myosin bands; arrows highlight defects in the myofibril alignment. Bar: 25 μm.
