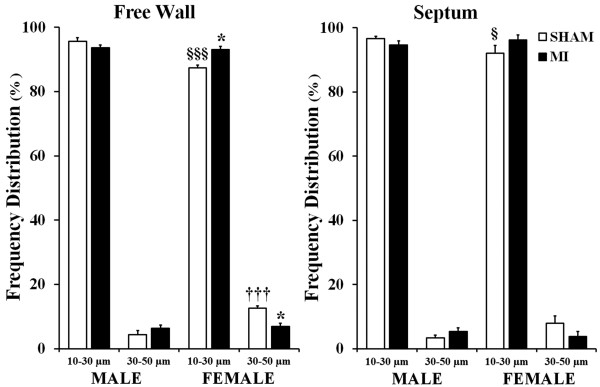
Figure 5.

Frequency distribution of arterioles relative to a vessel diameter group. Values are the mean ± SEM; n = 7 male rats/group; n = 6 female rats/group. A two-way ANOVA revealed a statistically significant interaction between the effects of sex and the experimental model on the frequency distribution of arterioles in LV free wall, F (1, 22) = 12.001, P = 0.003. *P < 0.05 vs. a corresponding sham group; §P < 0.05 and §§§P < 0.001 vs. M-Sham rats; †††P < 0.001 vs. M-MI rats.
