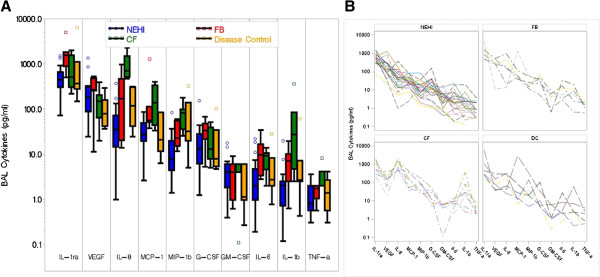
Figure 2.

Comparison of cytokine levels across disease groups. Cytokine profiles identified in BALF of NEHI, FB, CF and Disease Controls all values expressed as pg/mL. A) Shows quantities on the log scale for each cytokine by group with box whiskers. The cyokines are ordered by overall median value. The middle line corresponds to the median; the ends of the box indicate the 25th and 75th percentiles; the whiskers are drawn from the box to the most extreme point within 1.5 interquartile ranges and any value more extreme than this is marked with a point. B) Patient specific cytokine profiles separately by group. Cytokine values within a subject are connected by lines.
