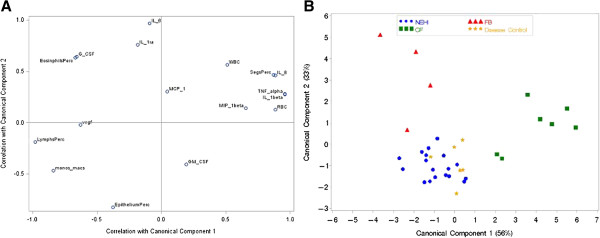
Figure 3.

Results from canonical discriminant analysis. Canonical Discriminant Analysis is a multivariate method similar to Principal Component Analysis (PCA) yet differs in that we have prior knowledge of the groups. A) displays the correlation between each BALF measurement and the first two components which cumulatively explain 89% of the group differences. This displays the weights attributed to each BALF variable which are used to calculate the scores for each sample. B) A plot of the first two component score values for each individual identified by disease group. The first two components result in good separation between disease groups, the CF and FB groups are distinguished from the NEHI and disease controls which look similar.
