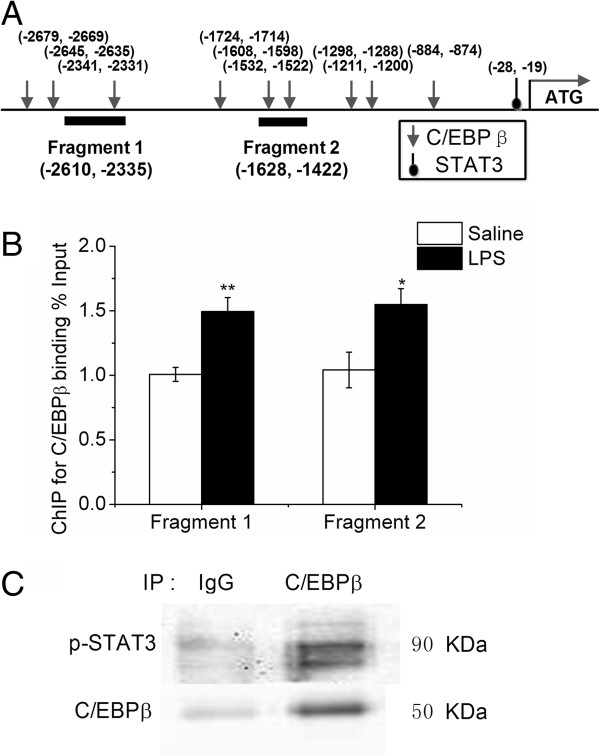
Figure 5.
Schematic structure of chicken FTO gene promoter (A), C/EBPβ binding to FTO gene promoter 2 h after LPS injection (B) and protein-protein interaction of p-STAT3 and C/EBPβ in liver (C). Values are mean ± SEM, n = 6/group, □ means control group and ■ is LPS group. *P < 0.05 vs Saline 2 h; **P < 0.01 vs Saline 2 h.

