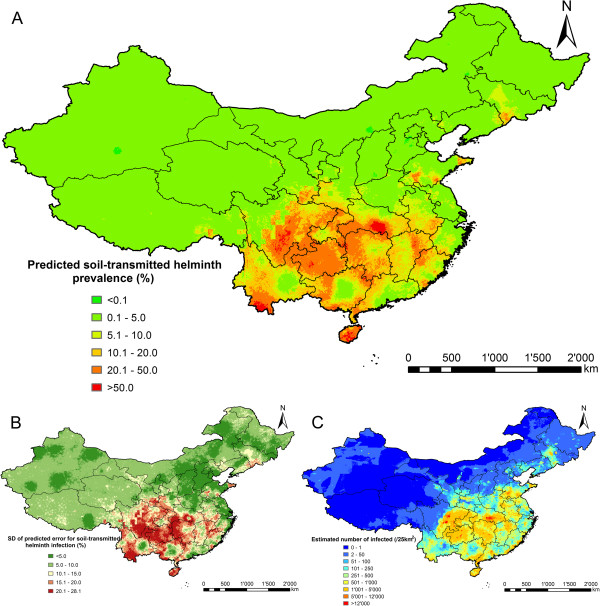
Figure 5.
The geographical distribution of soil-transmitted helminth infection risk in P.R. China. The maps show the situation from 2005 onwards based on the median and standard deviation of the posterior predictive distribution. Estimates of (A) infection prevalence, (B) prediction uncertainty and (C) number of infected individuals.

