
Figure 1.
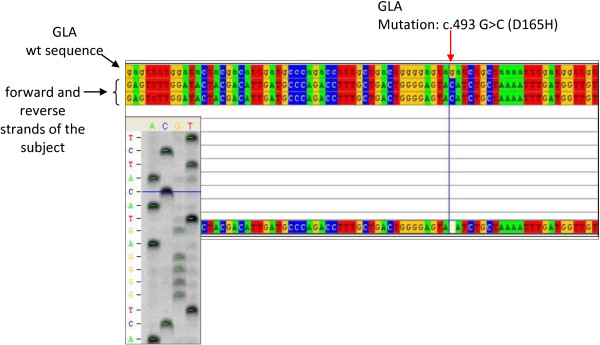
Alignment of gene sequences. Portion of the sequence of exon 3 of the GLA gene in Patient 2 (forward and reverse strands of the subject) aligned with the corresponding sequence of a healthy control (wt). The red arrow indicates the position of the mutation c.493 G > C (D165H in the protein). On the left, the sequencing gel image is shown.