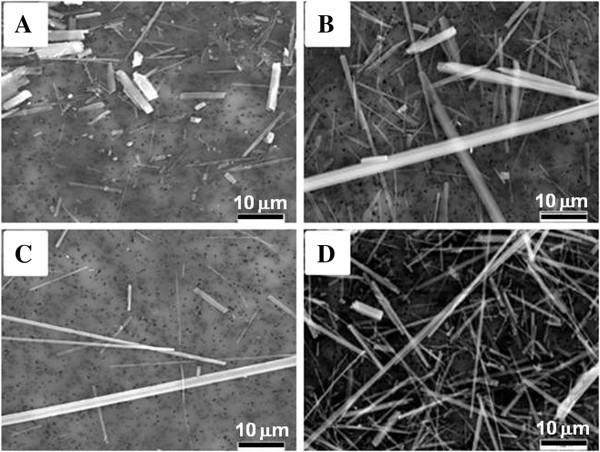
Figure 1.

Scanning electron microscopy images of amphibole samples. Representative SEM images obtained at 2000x magnification of (A) LA2000, (B) LA2007, (C) RTI amosite and (D) UICC amosite illustrating the relative morphology and size distribution of the mineral particles. Images do not reflect equal masses of each sample. Scale bars are 10 μm.
