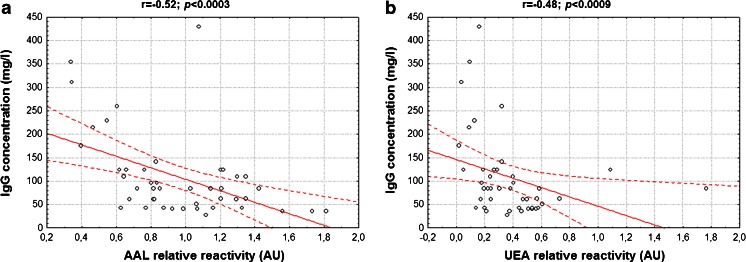
Fig. 2.
Dependence between IgG concentration and IgG relative reactivity with lectins. Correlation between IgG concentration and IgG relative reactivity with AAL (a), and UEA (b) was estimated according to a Spearman test, with a two-tailed p-value of less than 0.05 considered significant. 95 % confidence interval is marked by dotted lines

