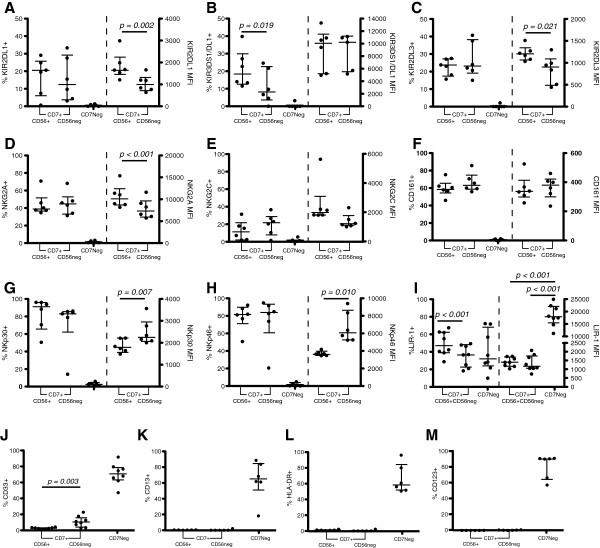
Figure 2.
Phenotypic characterization of CD7+CD56+CD16+ and CD7+CD56negCD16+ NK cells and CD7negCD56negCD16+ cells in healthy donors. CD3negCD14negCD19neg cells were gated for CD56+ and CD56neg cells and plotted against CD7 to identify CD7+ NK cells and CD7neg monocyte or DC-like cells. The percentage of CD7+CD56+CD16+ and CD7+CD56negCD16+ NK cells and CD7negCD56negCD16+ monocyte or DC-like cells expressing each receptor was determined (n = 6). A-I, Expression of NK cell-associated receptors on the different cell subsets. J-M, Expression of myeloid-associated markers on the different cell subsets. The median and 25th and 75th percentile are indicated on each graph.

