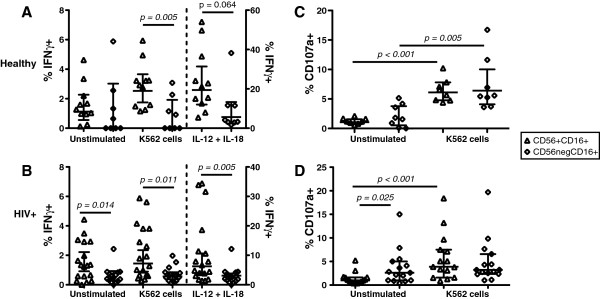
Figure 6.

Assessment of IFN and CD107a expression by CD7+CD56+CD16+ and CD7+CD56negCD16+ NK cells following in vitro stimulation. A-B IFNγ expression was compared between CD7+CD56+CD16+ and CD7+CD56negCD16+ NK cells in (A) healthy and (B) chronic HIV-1-infected donors following incubation in media alone, IL-12 plus IL-18, or K562 target cells. C-D, CD107a expression was compared between CD7+CD56+CD16+ and CD7+CD56negCD16+ NK cells in (C) healthy and (D) chronic HIV-1-infected donors following incubation in media alone or K562 target cells. A total of 10 healthy and 19 chronic HIV-1-infected donors were assessed. A minimum of 200 cells and 70 cells were analyzed for IFNγ and CD107 expression in CD7+CD56+CD16+ and CD7+CD56negCD16+ NK cells, respectively, of healthy donors. A minimum of 550 cells and 100 cells were analyzed for IFNγ and CD107 expression in CD7+CD56+CD16+ and CD7+CD56negCD16+ NK cells, respectively, of HIV-1-infected donors. The median and 25th and 75th percentile are indicated on each graph. ( = CD7+CD56+CD16+ NK cells;
  = CD7+CD56negCD16+ NK cells).
