
Figure 2.
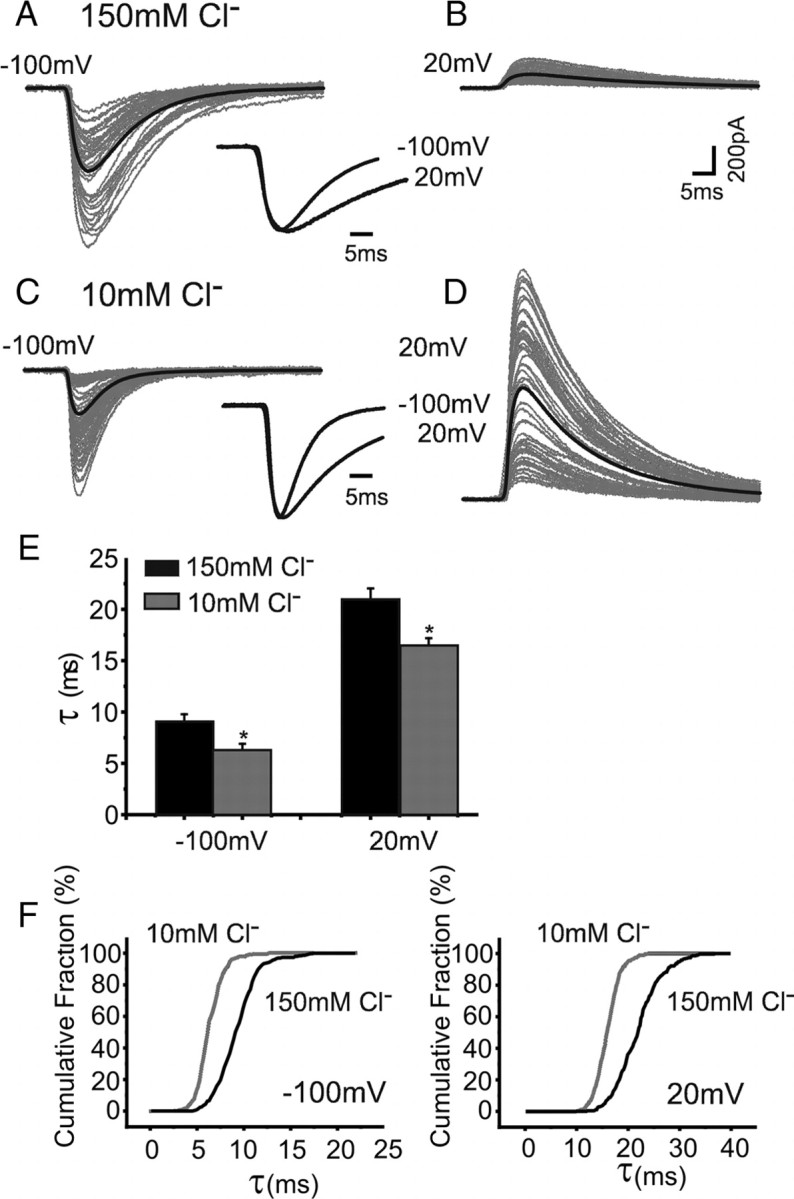
Intracellular Cl− regulates the decay phase of spontaneous IPSCs. A, sIPSCs (gray) and averaged sIPSC (black) recorded from Purkinje cells with 150 mm Cl− internal solution at −100 mV. The averaged and peak-scaled sIPSCs recorded at −100 and 20 mV (sIPSCs are inverted) are overlaid (inset). B, The same protocol as in A for individual and averaged sIPSCs recorded at 20 mV. C, sIPSCs recorded using 10 mm Cl− in the patch pipette (gray lines), at −100 mV. Averaged and peak-scaled sIPSCs at −100 and 20 mV are overlaid (inset). D, sIPSCs clamped at 20 mV (10 mm Cl−). The scale bar in B applies to all. E, Bar chart of mean sIPSC decay-time constants at different holding potentials with high (black) or low (gray) internal Cl−. F, Cumulative probability plots for sIPSC decay times at −100 mV and +20 mV with high (black) and low (gray) Cl−.