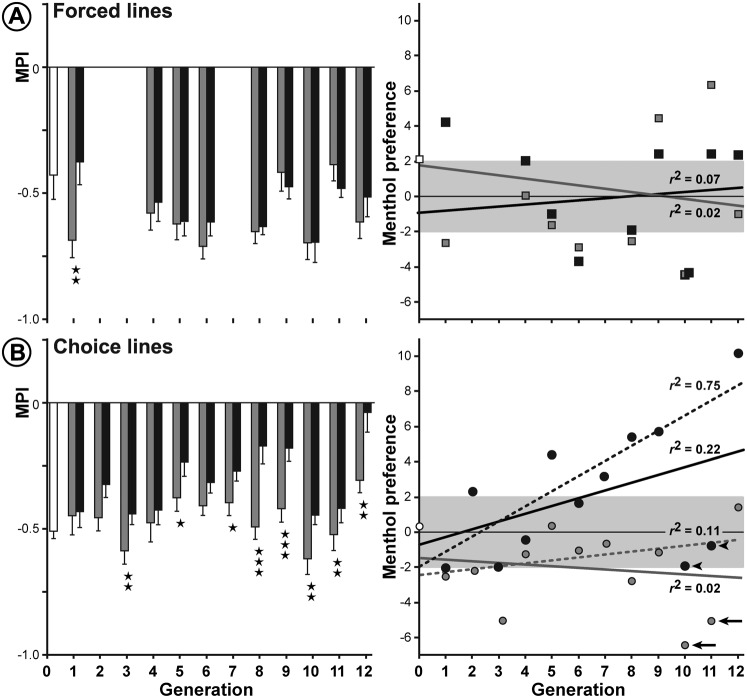
Fig. 3. Oviposition site preference on menthol in forced lines (A) and choice lines (B).
Left panels: bars represent the mean (± SEM) for the oviposition site preference (MPI) in lines either maintained on P-food (P-line; shaded bars), or on M-food (M-line, filled bars); the control line is shown as empty bars. The performance of both forced lines was measured at several generations between F1 and F12 together with that of the control (unselected) line at the beginning (F0; empty bar). The significance of Mann–Whitney U-tests are indicated as *p<0.05; **p<0.01; ***p<0.001; n = 18–38. Right panels: linear regressions of Menthol Preference by Generation in control, P- and M-lines (respectively, empty, shaded and filled symbols). Menthol Preference is significant when higher than 1.96 or lower than −1.96 (outside of the shaded pattern). Regression lines of P- and M-lines (respectively, grey and black) are represented with their corresponding r2-values. For choice procedure, arrows and arrowheads pinpoint F10 and F11 flies that negatively impacted the regression similarly in P- and M-choice females. For information, dotted lines (with the corresponding r2-values) represent the regression lines when excluding F10 and F11 data.

