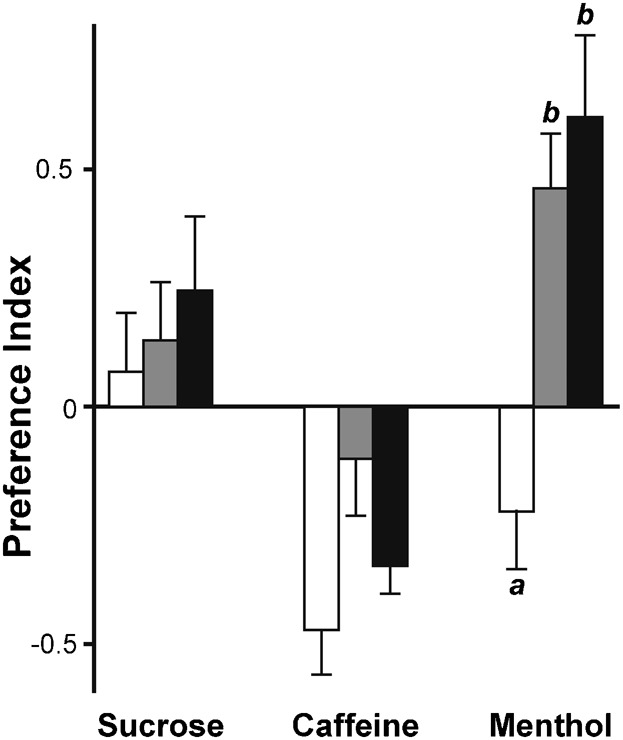
Fig. 5. Oviposition site preference to diverse food molecules in choice lines.

Bars represent the mean (± SEM) for the oviposition site preference (MPI) in control, P-choice and M-choice lines (empty, shaded and filled bars, respectively) to sucrose, caffeine or menthol. Tests correspond to the F24 and F25 generations. Kruskal–Wallis tests were only significant for menthol (K2df = 18.538, p<0.0001) but not for caffeine (K2df = 1.688, p = 0.442) or for sucrose (K2df = 0.801, p = 0.667). Letters represent the significant differences (p = 0.05) with a Kruskal–Wallis test (n = 10–23).
