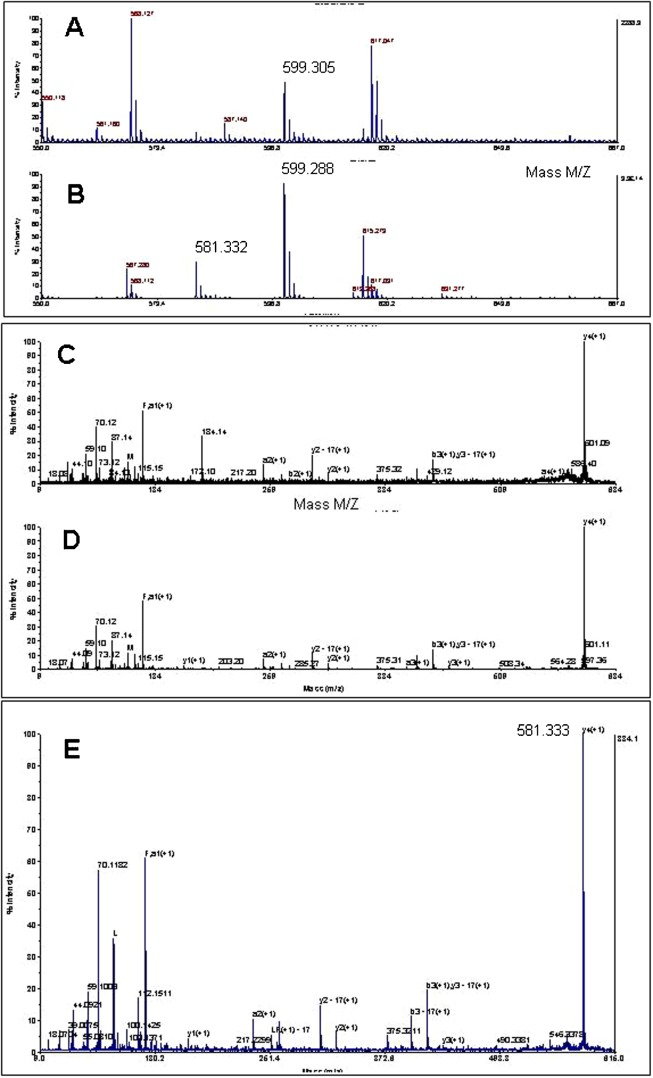
Fig. 4. Proteomics analysis of peptide extracts of the SG and optic lobe. MALDI mass spectra of peptides were obtained after HPLC fractionation of extracts.
(A,B) Partial spectra of mass spectrometric survey scans in MS1 in the mass range of 550 to 1000 Da containing peptides of the SG (A) or optic lobe (B). (C,D) Mass spectra of high energy collision-induced dissociation MSMS with an inclusion mass of 599.3 Da corresponding to that of FMRFamide from SG (C) or optic lobe (D). MSMS was triggered by a signal to noise ratio of the peptide at MS1 above 100. (E) Mass spectra of high energy collision-induced dissociation MSMS with an inclusion mass of 581.3 Da corresponding to that of FIRF-amide or FLRF-amide of molecules obtained from the optic lobe.

