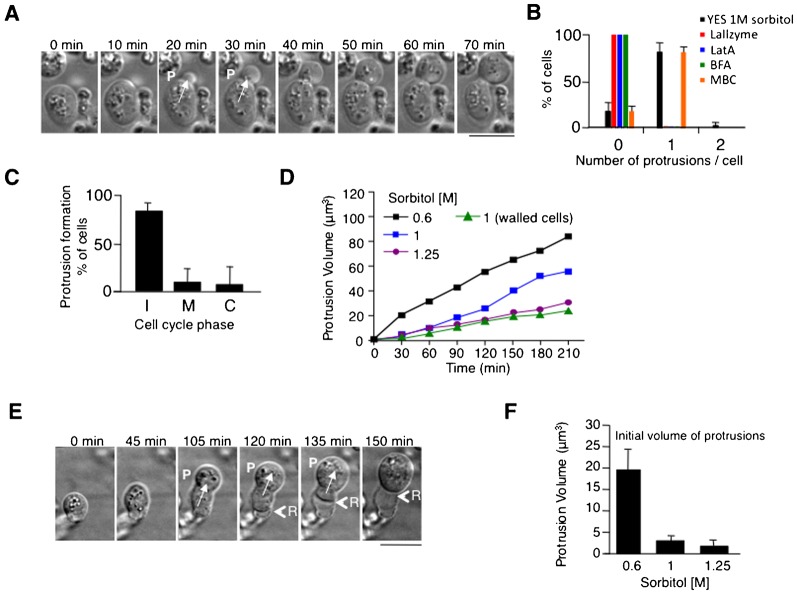
Fig. 1. pck2Δ cells form cellular protrusions.
(A) Time-lapse DIC images of RP-pck2Δ cells forming protrusions in 1 M Sorbitol. P marks appearance of a protrusion. (B) Percentage of cells with the indicated number of protrusions in the indicated conditions. (C) Cell cycle stage of cells initiating a protrusion. Frequency of protrusion appearance at different stages of the cell cycle (I interphase, M mitosis and C cytokinesis). (D) Protrusion volume increase in protruding RP-pck2Δ. Volume increase during growth of walled pck2Δ in 1 M Sorbitol is also shown. (E) Time-lapse DIC images of a protruding RP-pck2Δ cell showing the retraction (R) of the cell body as the protrusion expands. (F) Average protrusion volume in the first video frame where protrusion is visible in RP-pck2Δ cells at the indicated osmolarity. Scale bars: 5 µm.

