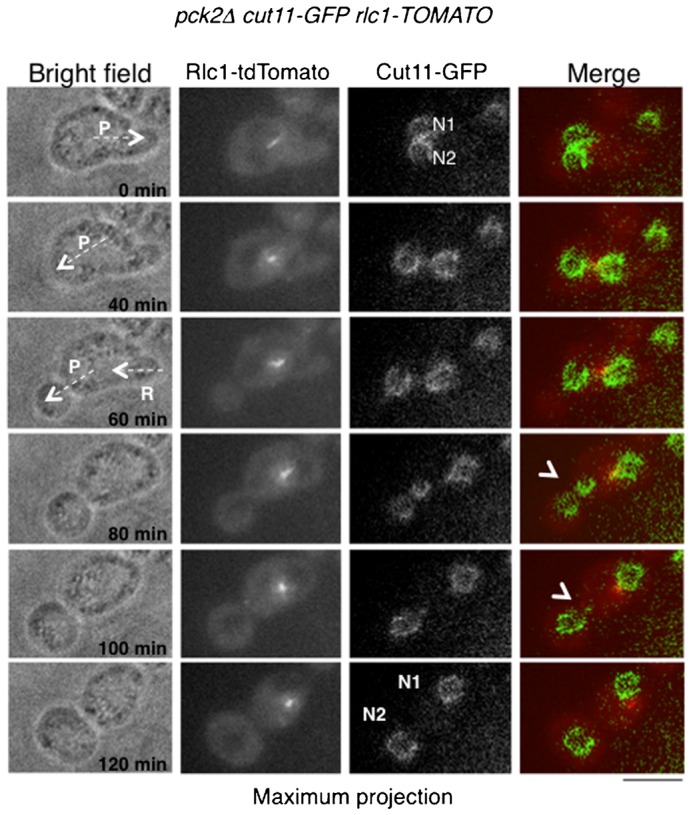
Fig. 6. Nuclear segregation driven by protrusion formation.

Protruding RP-pck2Δ cell expressing Rlc1-tdTomato and Cut11-GFP as markers of the actomyosin ring and nuclear envelope (NE) were recorded in multiple focal planes every 20 minutes. Maximum z projections of fluorescence and single sections of bright field images of representative time points are shown. P and arrow at time 0 min and 40 minutes indicate the formation of a protrusion. R at time 60 minutes denotes the retraction of a previously formed protrusion when the second one appeared. N1 and N2 show the two nuclei present in the cell. Arrowheads indicate deformation of the nucleus when it is passing through the neck toward the protrusion. Scale bar: 5 µm.
