
Figure 2.
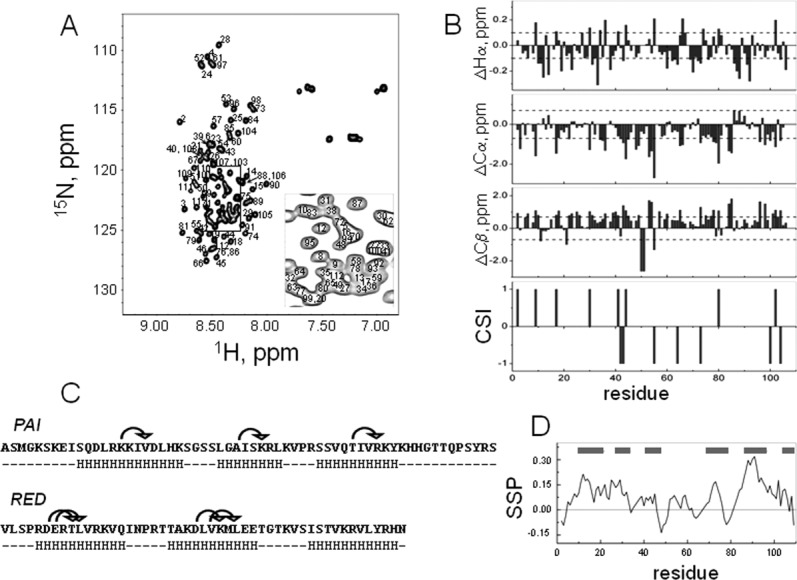
A: [15N,1H]-HSQC spectrum of the DNA-binding domain of SB transposase with assignments shown. The spectrum was acquired at 5°C in aqueous (5% D2O/95% H2O) 20 mM sodium acetate buffer at pH 5.2. The spectrum has poor chemical shift dispersion, showing that the protein is mostly unstructured. B: Chemical shift difference index plots of Hα, Cα, and Cβ. The random coil values for Hα and Cα have been adjusted for sequence dependence.24 The reference lines in these plots correspond to threshold values at which differences begin to reflect regions of possible ordered secondary structure formation.24 Consensus chemical shift index (CSI) was calculated using Hα, Cα, and Cβ chemical shifts. C: Amino acid sequence of the DNA-binding domain of SB transposase, containing the PAI and RED subdomains. Arrows above the sequence show observed (i, i + 3) NOEs, indicative of alpha-helical conformation. HHH stretches below the sequence indicate predicted alpha-helical regions of protein. D: Secondary structure propensity (SSP) score shows tendency towards alphahelical conformation rather than the beta-structure.